Data storytelling transforms complex data into engaging narratives, combining data, visualization, and context to enhance understanding and decision-making. By simplifying analytics and adding emotional connection, it ensures insights are memorable and actionable.
Table of Contents
In an era where data is often referred to as the new oil, the ability to interpret and communicate complex analytics has become a crucial skill. Data storytelling, the art of transforming intricate data sets into compelling narratives, bridges the gap between raw numbers and actionable insights. It enables stakeholders to understand, engage with, and make informed decisions based on data. This article explores the significance of data storytelling, the techniques for crafting impactful data stories, and real-world examples demonstrating its power.
What is Data Storytelling?
Data storytelling combines data, visualization, and narrative to present insights in a coherent and compelling manner. It involves interpreting data, extracting meaningful insights, and weaving them into a story that resonates with the audience. While data provides the facts and figures, storytelling adds context and emotion, making the information relatable and understandable.
The essence of data storytelling lies in its ability to simplify complexity. By transforming complex analytics into digestible narratives, data storytelling empowers decision-makers to grasp the implications of data and take appropriate actions.
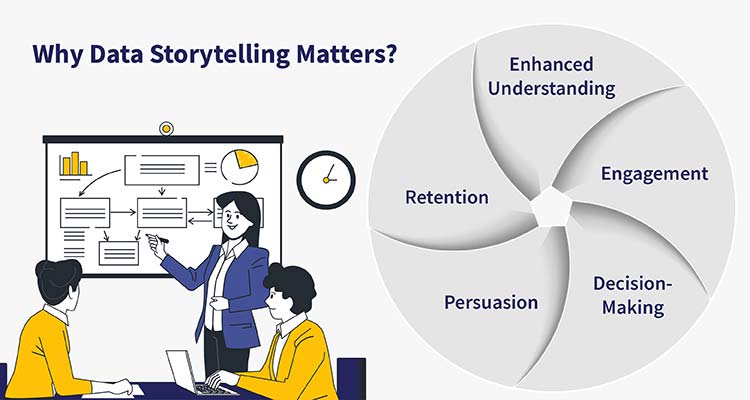
The Importance of Data Storytelling

Enhanced Understanding
Data storytelling simplifies complex data, making it accessible to a broader audience. By presenting data in a narrative format, it becomes easier for stakeholders to understand trends, patterns, and insights.
Engagement
A compelling data story captivates the audience, keeping them engaged and interested. This engagement is crucial for driving action and ensuring that the insights are not just heard but acted upon.
Decision-Making
By providing context and clarity, data storytelling aids in better decision-making. It helps stakeholders see the bigger picture, understand the implications of their decisions, and make informed choices.
Persuasion
A well-crafted data story can persuade and influence stakeholders, driving alignment and consensus. It presents data in a way that is not only factual but also emotionally compelling.
Retention
People are more likely to remember stories than raw data. Data storytelling ensures that the insights stick, making it easier for stakeholders to recall and act upon them later.
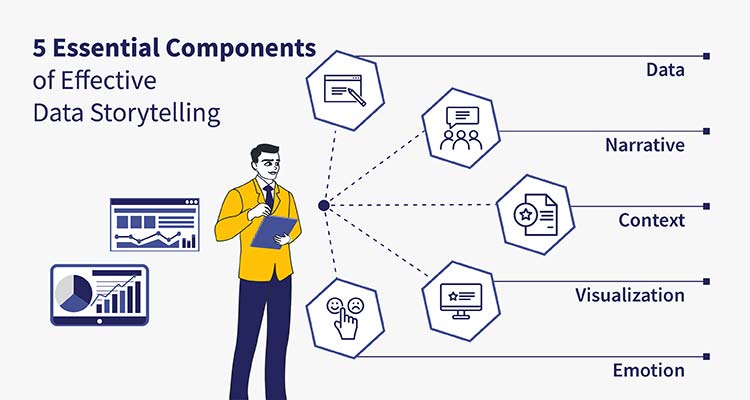
Top 5 Key Elements of Data Storytelling

1. Data
The foundation of any data story is the data itself. It should be accurate, relevant, and reliable. The data should be sourced from credible sources and should be processed and cleaned to ensure its quality.
2. Narrative
The narrative is the thread that weaves the data together. It provides context, explains the significance of the data, and guides the audience through the insights. A strong narrative has a clear beginning, middle, and end, and follows a logical progression.
3. Visualization
Visual elements such as charts, graphs, and infographics are essential for presenting data visually. Effective visualizations make complex data more accessible and help highlight key insights.
4. Context
Context is critical for understanding data. It includes background information, comparisons, and benchmarks that help interpret the data accurately.
5. Emotion
Emotion adds a human element to data stories. By connecting with the audience on an emotional level, data storytelling makes insights more impactful and memorable.
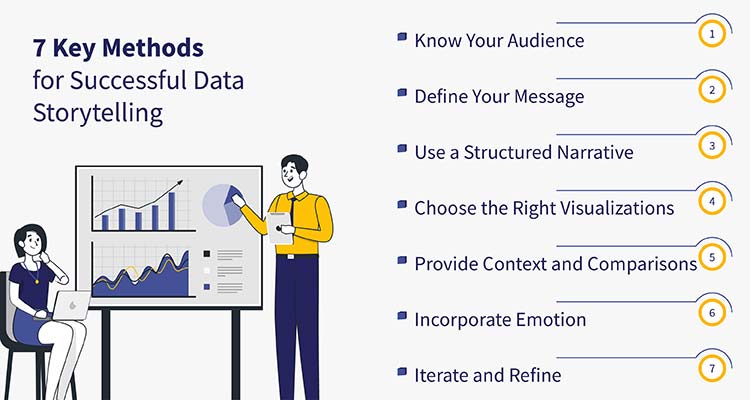
7 Techniques for Effective Data Storytelling

1. Know Your Audience
Understanding your audience is the first step in crafting an effective data story. Different audiences have different levels of data literacy and interest. Tailor your story to meet their needs, preferences, and expectations.
2. Define Your Message
Clearly define the core message of your data story. What key insight do you want to convey? Ensure that every element of your story aligns with and supports this message.
3. Use a Structured Narrative
Follow a structured narrative format. Start with an introduction that sets the stage, present the data and insights in the body, and conclude with actionable recommendations. Use storytelling techniques such as conflict and resolution to keep the narrative engaging.
4. Choose the Right Visualizations
Select visualizations that best represent your data and support your narrative. Use charts, graphs, and infographics to simplify complex data and highlight key insights. Ensure that your visualizations are clear, accurate, and easy to interpret.
5. Provide Context and Comparisons
Provide context to help your audience interpret the data. Use comparisons, benchmarks, and historical data to give perspective. Explain the significance of the data and why it matters.
6. Incorporate Emotion
Connect with your audience on an emotional level. Use storytelling techniques such as anecdotes, testimonials, and personal experiences to make the data more relatable and impactful.
7. Iterate and Refine
Data storytelling is an iterative process. Gather feedback from your audience, analyze its effectiveness, and refine your story accordingly. Continuously improve your storytelling skills and techniques.
Real-World Examples of Data Storytelling
1. Google’s Year in Search
Google’s annual “Year in Search” report is a prime example of effective data storytelling. It combines search data with compelling narratives and visualizations to highlight the year’s major trends and events. The report provides context, emotional resonance, and actionable insights, making it engaging and memorable.
2. Netflix’s Viewer Insights
Netflix uses data storytelling to share insights about viewer behavior and preferences. Through blog posts, presentations, and reports, Netflix presents data on viewing trends, popular genres, and user engagement. The narratives are supported by clear visualizations and contextual explanations, making the insights accessible to a broad audience.
3. Airbnb’s Growth Story
Airbnb’s growth story is often shared through data storytelling. By presenting data on bookings, user demographics, and market expansion, Airbnb tells a compelling story of its growth and success. The narratives are enriched with visualizations and anecdotes, making the data come alive.
4. TED Talks
Many TED Talks use data storytelling to convey complex ideas. Speakers often combine data with personal stories, visualizations, and emotional appeal to engage the audience and drive home their message. These talks demonstrate the power of data storytelling in inspiring and influencing people.
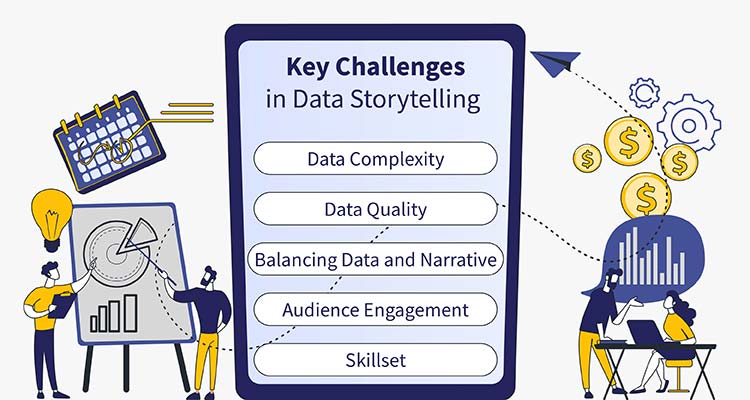
5 Major Challenges in Data Storytelling

Data Complexity
Data can be complex and overwhelming. Simplifying complex data without losing its essence is a significant challenge in data storytelling. It requires a deep understanding of the data and the ability to distil it into clear, concise narratives.
Data Quality
The quality of data is critical for effective storytelling. Inaccurate, incomplete, or biased data can lead to misleading narratives and incorrect conclusions. Ensuring data quality and reliability is essential for building trust and credibility.
Balancing Data and Narrative
Striking the right balance between data and narrative is challenging. While the narrative should be engaging and compelling, it should not overshadow the data. Ensuring that the data supports and enhances the narrative is key to effective data storytelling.
Audience Engagement
Keeping the audience engaged throughout the data story is crucial. It requires a deep understanding of the audience’s interests and preferences, as well as the ability to present data in an engaging and relatable manner.
Skillset
Data storytelling requires a diverse skillset, including data analysis, visualization, and storytelling skills. Developing these skills and integrating them effectively can be challenging, especially for individuals and organizations new to data storytelling.
Key Future Trends in Data Storytelling
Interactive Data Stories
Interactive data stories allow the audience to explore data and insights dynamically. By incorporating interactive elements such as dashboards, maps, and filters, data storytellers can create immersive and engaging experiences.
AI-Powered Storytelling
Artificial intelligence (AI) is transforming data storytelling by automating data analysis and visualization. AI-powered tools can generate narratives, identify key insights, and create visualizations, making data storytelling more efficient and scalable.
Augmented Reality (AR) and Virtual Reality (VR)
AR and VR technologies are enhancing data storytelling by creating immersive and interactive experiences. By visualizing data in 3D and virtual environments, data storytellers can present complex data in new and innovative ways.
Personalized Data Stories
Personalization is becoming a key trend in data storytelling. By tailoring data stories to individual preferences and needs, data storytellers can create more relevant and impactful narratives.
Storytelling with Big Data
As the volume of data continues to grow, storytelling with big data is becoming increasingly important. Data storytellers need to develop techniques
Conclusion
Effective data storytelling is an essential skill in today’s data-driven business environment. By combining robust analysis with compelling narratives and clear visualizations, you can transform complex data into actionable insights that drive decision-making and create value for your organization.
Remember that great data storytelling is both an art and a science. It requires technical expertise to analyze the data, creativity to craft the narrative, and empathy to understand and connect with your audience. By following these principles and best practices, you can create data stories that not only inform but inspire action.
The most successful data storytellers are those who can adapt their approach based on their audience while maintaining the integrity of their data and analysis. As you develop your data storytelling skills, focus on creating clear, compelling narratives that help your audience understand not just what the data shows, but why it matters and what they should do about it.
← Back to Blog


