Need a tailored data visualization dashboard?
Unlock the potential business outcomes of your real estate business data with ML driven reporting & visualization.
Get in Touch With Us

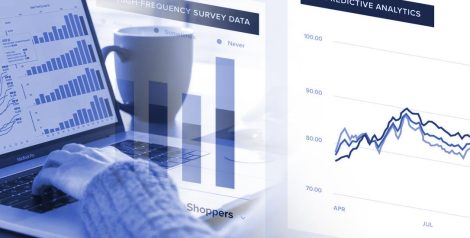
Hitech real-estate data analytics create intuitive dashboards and data visualization that is designed to convert complex data into diagrammatic representations, and graphical elements, while ensuring seamless data interactivity and aggregation to interpret real estate market trends, opportunities, customer analysis, operations analysis and many more.
Our data visualization services unravel the knowledge embedded in your data to empower your decision-making, delivering customized strategies and solutions and optimizing your investments.
Hitech data visualization and reporting plays a crucial part in the real estate industry since we help transforms unorganized data and data in silos into analyzed, intelligent and meaningful insights. This visualization enables real estate businesses to get insights into their sales and operational process, customer knowledge and CX, price dynamics, market trends, & key KPIs.
Our interactive and insightful data visualization allows real estate businesses to assess and anylyze various KPIs and patterns to gain actionable insights about market trends, tenancy, property value, property performance etc. Intelligent data visualization for real estate fosters insight driven strategies, improves property management & optimize business performance.
Get in Touch With Us
Our interactive dashboards follows a step-by-step process from business analysis, data management, analysis and the final visualization offering insights based on KPIs. The objective is to provide crucial information to decision-makers and other stakeholders to help plan effectively.
Get in Touch With UsCommunicate complex data clearly through compelling reports and visualizations, aiding faster decision-making.

Comparative data on dashboard enable value & pricing plans for the property.

Understanding the market and key factors enables informed purchase diligence.

Attract and serve both buyers and sellers with knowledge of competition & win more.

Data visualization helps drive business growth enabled with targeted marketing.
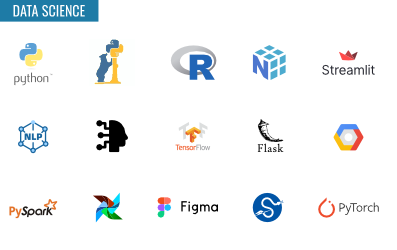
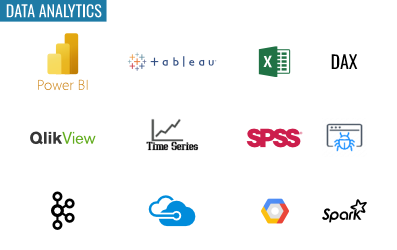
Discover the advanced technologies we use in data engineering, data science, and data analytics to unlock the full potential of your data.
Discover our Insights Corner, where you’ll find a curated collection of blogs, case studies, and expert insights designed to inspire innovation, enhance productivity, and guide you toward success in your projects.
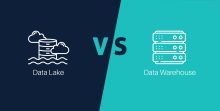
Efficient data architecture is essential to storing, retrieving and managing…
By HitechAnalyticsBusiness Outcomes 100% sentiment insights visualization Increased understanding of public…
By HitechAnalyticsBusiness Outcomes 50% increase in the sales reps’ productivity 200%…
By HitechAnalyticsSimplify data interpretation today.
Turn data into clear, actionable visuals.Disclaimer: HitechDigital Solutions LLP and HitechAnalytics will never ask for money or commission to offer jobs or projects. In the event you are contacted by any person with job offer in our companies, please reach out to us at info@hitechanalytics.com.