Is data load too overwhelming to analyze?
Connect with your customers and boost your bottom line with visible actionable insights.
Get in Touch With Us

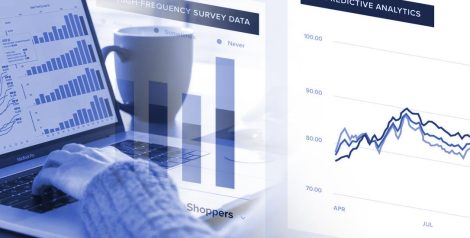
Data dashboard is like the oracle, a place where all the most important business metrics are available to provide wisdom to run your business, create your strategy and fire your ideas and actions for success.
Visualization is essential to both growing and established businesses — but they don’t all perform at the same level. However, needs are varying and exclusive across industries and organizations. There’s no one right way to design a dashboard, but implementing a set of time-tested strategic principles can help you to record compelling stories about your business to progress towards goals.
Hitech designs dashboards and visualization using data to tell a story that addresses all your business need. Our dashboard provides a visual representation that would give a quick & easy way to view company’s performance in real-time; by pulling the information from various data sources into one place for data analysis. The visualization gives real-time reports based on your industry and lines of business that would enable strategic and tactical decision-making
The more you use our dashboards and integrate them into your company’s workflows & processes, the more likely you will reap business benefits. We crate dashboard that provides efficiency in connecting business activities for both employees and clients.
Let’s Connect
Our visualizations and dashboards are customizable based on your needs. We create business Dashboards to make strategic plans and refine ideas. Executive & KPI dashboards to visualize crucial metrics and display the performance of key data points. Project and performance dashboards to view project status, insights & track overall business status. We also create operations dashboards for an end-to-end view of daily operations. Customizable industry dashboards cater to the needs of the user and business, and many more.
Let’s ConnectTransform complex data into clear, visual insights, enhancing communication and accelerating data-driven decisions.

Once set, dashboards save time on random data pulls, analysis and troubleshooting.

See KPI performance thru a user-friendly interface & make informed decisions.

Access real-time data to set, reflect on, and continuously refine your goals more regularly and effectively.

Dynamic real-time view of data helps to navigate critical & rapid change precisely.
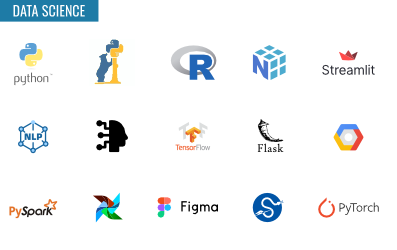
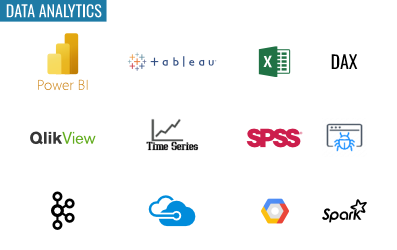
Discover the advanced technologies we use in data engineering, data science, and data analytics to unlock the full potential of your data.
Discover our Insights Corner, where you’ll find a curated collection of blogs, case studies, and expert insights designed to inspire innovation, enhance productivity, and guide you toward success in your projects.
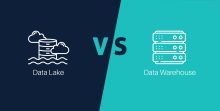
Efficient data architecture is essential to storing, retrieving and managing…
By HitechAnalyticsBusiness Outcomes 100% sentiment insights visualization Increased understanding of public…
By HitechAnalyticsBusiness Outcomes 50% increase in the sales reps’ productivity 200%…
By HitechAnalyticsVisualize your data clearly.
Create intuitive dashboards for impactful insights.Disclaimer: HitechDigital Solutions LLP and HitechAnalytics will never ask for money or commission to offer jobs or projects. In the event you are contacted by any person with job offer in our companies, please reach out to us at info@hitechanalytics.com.